- You are here:
-
Home

-
Best Practices & Strategies
- Infographics in online marketing are hot this year
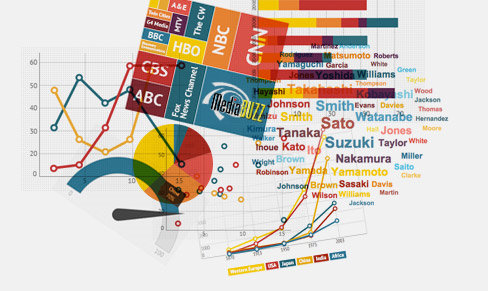 The net is full of information and partly bursting with large and complex issues. The time that we have to read and check content dropped steadily in the past years. Infographics explain contexts in a vivid and visually pleasing way that texts or pictures alone can’t often guarantee.
Reader-friendly, catchy and concise, immediate information are the advantages of infographics
Infographics explain and illustrate abstruse texts, thus facilitating comprehension of complex issues. Especially, technical facts and applications usually can’t be adequately depicted by photos or be simply described by plain text. In an infographic, the focus lies on the core features and product characteristics. Pure data is accompanied by an illustration and complex correlations are made clear in a playfully way, making infographics immensely popular in social networks: quickly understood, liked and shared.
Graphics pique viewers’ curiosity and thus those of potential customers. Interested parties are drawn into the subject and are more willing to read the appropriate information, increasing the visibility of your business at the same time.
Infographics have the advantage of:
- Making the reader understand complex contexts;
- Being able to compress large amounts of information;
- Illustrating issues visually;
- Being quickly memorable for the busy reader of today;
- Being cost effective, due to multiple exploitation on the website, press release, or product brochure.
Tips & tricks to create an infographic:
- Keep it simple: Do not try to include too much information in an image;
- The color is key: Thus, choose a color scheme, not to overwhelm the reader;
- Facts & figures: Investigate some amazing facts and statistics that you want to process visually;
- Imagine the infographic as a visual essay: Though, make sure that your arguments are relevant and coherent;
- Never forget: Infographics want to communicate knowledge quickly, therefore the meaning of complex content must be reader-friendly and easy to remember;
- Specify the source: always refer to the source of the information you are using.
For your own channels - corporate blog, Facebook page, Twitter stream, Pinterest, etc. - Infographics can be distributed via the communities with the following tools, quickly and effectively:
Piktochart
Piktochart is the pioneer among the infographics tools. It offers high usability and four free layout forms for the design. The editing mask is reminiscent of the presentation program keynote and is therefore quite user-friendly. Via a taskbar, familiar editing services can be selected and for $1.99 users can buy additional layout designs.
visual.ly
The service visual.ly allows you to visualize Twitter and Facebook data without having any design skills. The free service provides all in all three types of Twitter infographics and two Facebook variations. For creating an infographic, however, it is necessary to log in to Twitter or Facebook.
Google Public
With the Google charts explorer "Public Data" you can easily analyze, visualize and communicate large amounts of data. Besides text and tables, Google provides the option to create various graphics and the handling is intuitive and easy.
Whether studies or marketing reports, infographics can process any information and present them in an easy to grasp way – so what’s holding you back to jump on the bandwagon?
By Daniela La Marca
